Maps are quite a crucial element of studying our world, and this, among other kinds, is one of the most popular forms of the map – the political map. You have indeed most probably seen one in your classroom, on a globe, or in a textbook. But what do political maps display? Let’s delve into this subject with all simplicity so that even a 9th grader could easily get everything.
They show countries, states, and cities
They define borders between different places
Colors separate areas
Do not show natural features like rivers and mountains
Used in schools, news, and government planning
What Is a Political Map?
A political map is one of the maps that indicates how humans divide the world. It separates those parts of the world that are ruled by states and the federal government. It is concerned primarily with the borders between countries, states, provinces, and cities. Political maps have no focus on the natural landforms, as revealed by physical maps-pictures of rivers, mountains, etc.
You may think of it like this: a political map is the way to go if you would like to know where one country ends and another begins.
What Political Maps Usually Have
Let’s break down the major features that you’ll find on a political map.
1. Countries and Their Borders
Of course, a political map is to show you the Earth with all its countries on it. Cartographers mark each country with distinct colors or boundary lines to ensure it stands out clearly. The United States, for instance, might be blue, and Canada could be green.
Borders are usually represented by thick black or colored lines
2. States, Provinces, and Territories
Inside countries, political maps also indicate smaller divisions such as:
- States in the United States
- Provinces in Canada
- Regions in other countries
These divisions tell us about how power and government are structured within a country.
3. Capital Cities and Major Cities
Cities are also indicated on political maps, particularly capital cities such as:
- Washington, D.C. (USA)
- New Delhi (India)
- London (UK)
Other large cities such as New York, Mumbai, or Tokyo can also be represented by dots or symbols.
Symbols and Colors Used in Political Maps
Mapmakers use symbols and colors on political maps to enhance readability. Below, you’ll find a brief table that highlights common elements you might encounter.
- Symbol/Color What It Represents
- Various Colors, Various countries or states
- Black/Dotted Lines Borders or boundaries
- Stars Capital cities
- Dots/Circles Major cities
- Bold Letter: Names of countries
This system allows individuals to comprehend the map at a glance without reading everything.
Why Political Maps Matter
Political maps serve us in several different ways and for many different purposes. Here are the ways that they assist us on a day-to-day basis:
- In Schools, Students learn about geography and history using them.
- In Government: Politicians utilize them in planning laws and decision-making.
- In News: Political maps are utilized by journalists in order to demonstrate world affairs, such as wars or elections.
- In Travel: Travelers utilize them to learn which nations they’ll be traveling to.
- People use maps not just to learn, but to understand how human choices have shaped the structure of the world.
- Political vs Physical Maps
- It’s simple to confuse political maps with physical maps, but they’re quite different.
Feature Political Map Physical Map
Focus Man-made boundaries Natural landmarks
Displays Nations, cities, states, Mountains, rivers, and deserts
Utilized For Government, news, school Science, environment, nature studies
Remember at all times: Political = People’s divisions.
Physical = Nature’s land.
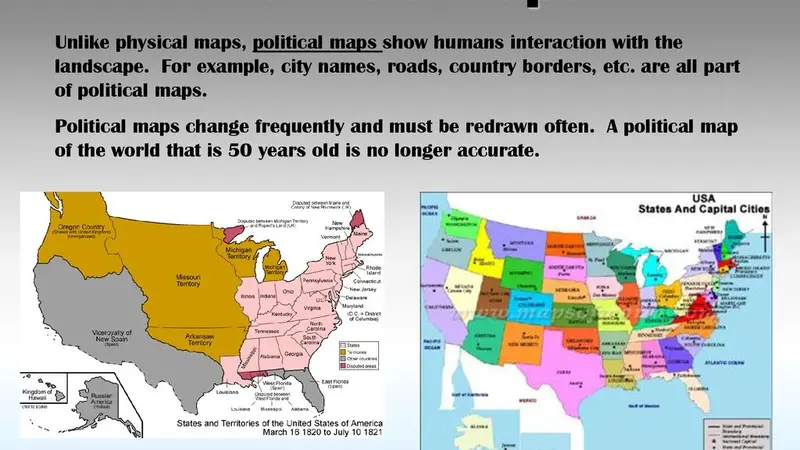
Real-Life Illustration: The United States Map
Let’s consider a political map of the USA:
- Cartographers display all 50 states, using a different color for each to distinguish them easily.
- Mapmakers indicate boundaries between states, like Texas and Oklahoma, to show where each one begins and ends.
- Cartographers mark capital cities, like Austin in Texas and Sacramento in California, with stars to distinguish them from other locations.
- Mapmakers also mark large cities like New York City and Los Angeles to highlight major urban areas.
- These maps help children learn where places are located and how the nation divides into different regions
Fun Fact
Did you know? Some political maps mark disputed territories—those places where two nations have conflicting claims over the same territory. Mapmakers often use unique lines, like dotted or dashed borders, to indicate boundaries.
3 Short and Crucial FAQs
Q1: Do political maps indicate oceans and rivers?
No, political maps don’t concentrate on natural landmarks such as oceans, rivers, or mountains. They might look it up for reference purposes, but that’s not the primary function.
Q2: Are political maps updated frequently?
Yes! Nations occasionally shift borders, or new nations emerge. Political maps are revised to incorporate these changes.
Q3: Can political maps be used in elections?
Yes. People often use these maps to show voting districts, display election returns, and illustrate how different regions vote.
Final Thoughts
Humans, governments, and city planners shape the globe’s divisions, and political maps help us grasp this structure. These maps show us where nations and states exist, pinpoint the locations of capital cities, and reveal how human decisions have organized the world.
The next time you glance at a map, take a close look. If you notice borders, nations, and cities, you’re likely staring at a political map, a straightforward yet potent means of comprehending our world.